Last Updated on October 17, 2026
If you are a Windows power user, then you most likely pay attention to how fast your computer boots up and how long it takes to log in. When things start to get slow, it can be hard to diagnose exactly what is causing the boot time delay. Finding the exact culprit requires the right diagnostic utility.
Fortunately, there is a free app you can use to check the boot time and boot performance of your PC. The tool we will be discussing in this article is called BootPerformanceView by Nirsoft who has a large variety of free tools you can use to manage your computer. This lightweight software runs instantly without any complex installation process.

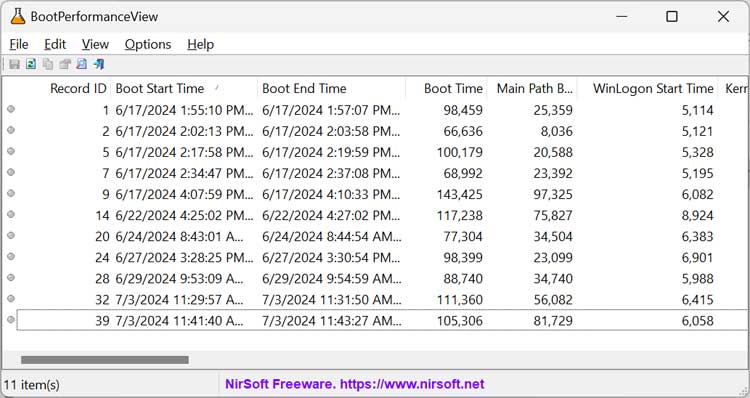
BootPerformanceView displays the performance information of the boot process on your PC. The information used by BootPerformanceView is obtained from the Microsoft-Windows-Diagnostics-Performance/Operational event log. This guarantees the data you see comes directly from your native operating system records.
Getting Started with BootPerformanceView
1. Bypass the Security Warning
The software consists of a single executable file that you can run and does not require any installation. You may run into security issues when downloading this file, but Microsoft Edge seems to allow the file to be downloaded without any issues. When you first run the file, you may get a message from Windows saying the Microsoft Defender SmartScreen prevented an unrecognized app from starting. You can then click on More info and then the Run anyway button to get past this message.

2. Review the Boot Data Columns
When BootPerformanceView starts, you will see many columns of information. There is a good chance that many of them will contain information that either does not make sense or that is of no use to you. The columns you will most likely find useful are the Boot Start Time and Boot End Time columns. The Boot Time column shows the total time the computer took to boot and is shown in milliseconds.
3. Analyze the Record ID
If you sort the columns by Record ID, the first record should show you when Windows was installed. You can even look at the Computer Name column and see if the name is different than the current name of the computer. This helps track historical changes assuming you had renamed it at some point.
Customizing Your Performance View
1. Modify the Visible Columns
Since this tool is a pre-release program as of this writing, there is not much information on the website or from the help menu. What you can do is go to the View menu and then uncheck any columns you do not need to be shown in the app. You can also change their order here and you can also drag and drop the column order from within the app itself.

2. Generate an HTML Report
If you want to run a report on the data from this app, you can go back to the View menu and choose the HTML Report option for all items or selected items. This generates a clean webpage containing your exact boot metrics. You can easily save this file for future troubleshooting reference.
3. Check Remote Computers
If you want to see boot information for a different computer, you can go to the File menu and select the Choose Data Source option. Here you will have options for this system, external file, remote computer, multiple remote computers and shadow copy. This makes it an excellent diagnostic tool for network administrators managing multiple workstations.

4. Download the Application
As you can see, BootPerformanceView is an effective way to check the boot time and boot performance of your PC. You can download BootPerformanceView here. Just be sure to copy the zip file password at the top of the page so you can extract the executable file.
For additional training resources, check out our online IT training courses.
Check out our extensive IT book series.