Last Updated on May 21, 2026
These days, almost everyone is running an SSD (Solid State) drive in their computer. Most laptops now come with SSD drives exclusively.
You only really see older spinning disks as secondary data drives in new computers since SSD drives such as NVMe drives are so much faster and tend to be used to run Windows and other operating systems.

SSD drives do not have any moving parts, which means when they start to fail, you will not hear the typical clicking sound that indicates a pending issue.
This is exactly where SSD monitoring software comes into play to help you manage the health of your hard drives.
In this article, we will be showing you how to check your SSD power on count, power on hours, and other health stats with CrystalDiskInfo.
Understanding S.M.A.R.T. Data
S.M.A.R.T. stands for Self-Monitoring, Analysis, and Reporting Technology. It is a vital monitoring system included in nearly every modern hard drive and SSD.
While Windows doesn’t give you an easy way to read this data natively, CrystalDiskInfo decodes these attributes into a user-friendly dashboard.
Monitoring this data is the best way to predict a drive failure before it actually happens. Unlike older mechanical drives that might click or grind when they fail, an SSD will often simply stop working without warning.
Checking these health stats at least once a month is a great habit for your overall data safety.
CrystalDiskInfo is a free and lightweight drive-monitoring tool that displays detailed health information for SSDs, NVMe drives, and even traditional hard disks.
It reads your SMART data to show real-time stats like temperature, power-on hours, power-on count, drive health status, error rates, and firmware details.
There is an installable and standalone version of CrystalDiskInfo available to download. Many people prefer the standalone version since there is absolutely nothing to install on your computer.
Once you download and extract the zip file, you can simply run the DiskInfo64.exe file to open the application.
Once CrystalDiskInfo is running, you will immediately see a lot of information about your primary drive.
If you have more than one hard drive in your system, you will be able to toggle between them. You can do this by clicking on the one you want to view at the top of the app or by using the back and forward arrow buttons.
You will also see the overall health status, which is a great indication of how much life the drive has left.
Plus, it will show the overall temperature of the drive right below that so you can easily see if it is running hot.
What Do the Health Status Colors Mean?
CrystalDiskInfo uses a simple color-coded system to tell you the current condition of your drive.
If you see a Blue status, this means Good. Your drive is healthy and operating completely within normal parameters.
If you see a Yellow status, this means Caution. The software has detected reallocated sectors or remaining life issues, which is a strict warning to back up your data immediately.
If you see a Red status, this means Bad. The drive is currently failing or has already reached its end-of-life threshold and requires immediate replacement.
If you see a Grey status, this means Unknown. The software cannot successfully communicate with the drive’s controller, which is a common issue with some external USB enclosures.
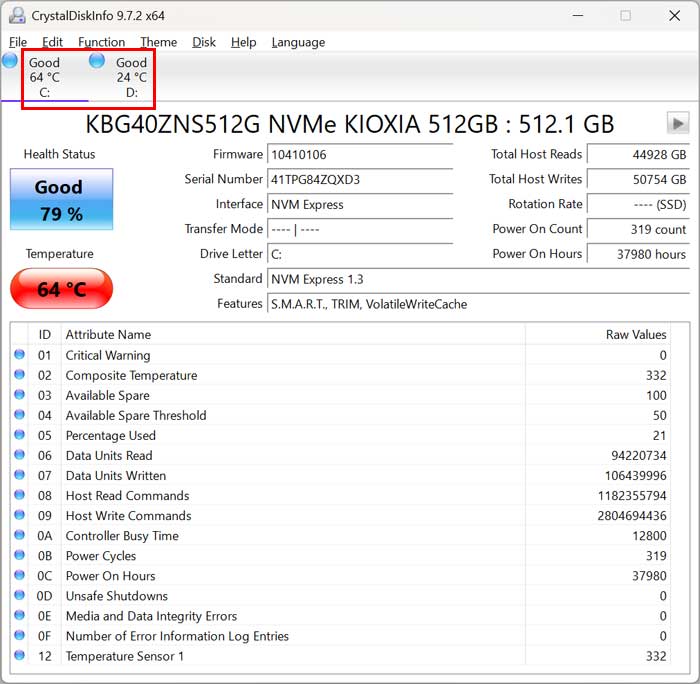
CrystalDiskInfo shows detailed information about your drive such as the firmware version, serial number, and physical interface connection type.
It also displays exactly what features your drive has supported, such as S.M.A.R.T, NCQ, APM, DevSleep, or TRIM.
On the right side of the app, you will see details about how much data was successfully read from and written to the drive.
This section also tells you how many times the drive was powered on and how many total hours it has been running.
The power on hours metric is not how many continuous hours it has been running, but rather the total lifetime hours. There are several ways to find out exactly how long your computer has been running during its current session.
Interpreting Power On Hours and Counts
Many users wonder what an unexpectedly “high” number of hours is for an average SSD. Most modern SSDs are rated for millions of hours of Mean Time Between Failures (MTBF).
However, for a standard consumer drive, seeing 20,000 to 30,000 hours is very common for a drive that is just a few years old.
More important than the total hours is the Total Host Writes. SSDs have a finite amount of data they can write before the flash memory officially wears out.
If you see high power on hours but relatively low total host writes, your drive likely has many years of life remaining.
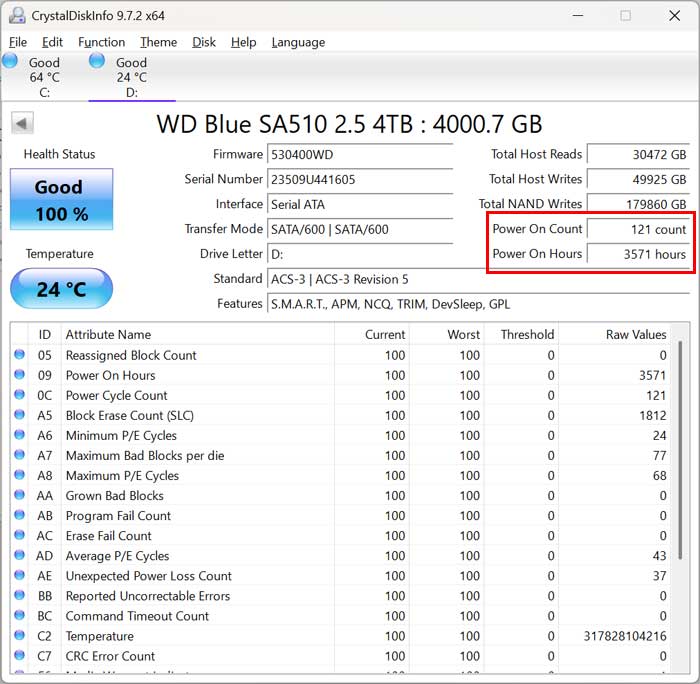
The bottom pane shows several other technical attributes about your hard drive. This includes your CRC error count, grown bad blocks, program fail count, and unexpected power loss count.
Many of these metrics will not be too helpful for the average user, but that will depend entirely on your specific troubleshooting needs.
You will also notice that the raw values are displayed in hexadecimal by default. These can easily be converted to decimal if you change the display type in the app settings.
CrystalDiskInfo has some additional settings you can manually configure to suit your preferences. Most of these can be found under the Function menu and then clicking the Advanced Feature sub-menu.
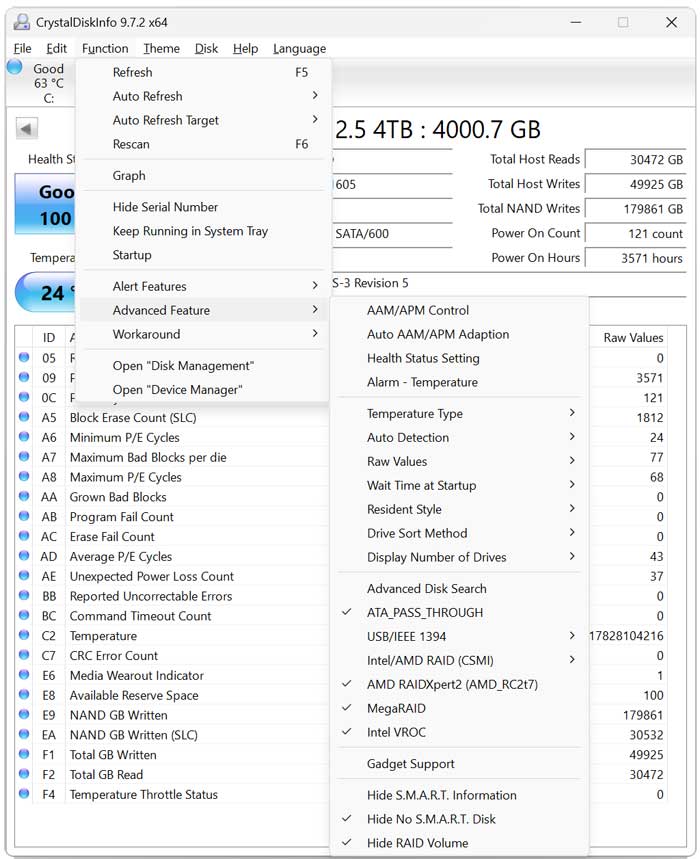
For example, if you want to change the temperature display from Celsius over to Fahrenheit, you can do that right from here.
You can also do advanced things such as setting up automated email or audio alerts for when your drive gets too hot.
CrystalDiskInfo & SSD Health FAQ
Can CrystalDiskInfo fix a “Caution” status?
No, this software is exclusively a monitor and not a repair tool. If a drive is marked as Caution, the physical hardware is wearing out and no software can fix those failing sectors.
Why is my SSD temperature showing in Red?
NVMe SSDs naturally tend to run much hotter than older SATA SSDs. If your drive is consistently above 60°C to 70°C, you may want to look into adding a dedicated heatsink or improving your computer case’s airflow to prevent thermal throttling.
Does this work with external USB drives?
Yes, but it heavily depends on the specific USB controller inside the external case. Most modern external SSDs and HDDs will pass their SMART data through to CrystalDiskInfo without any issue.
For additional training resources, check out our online IT training courses.
Check out our extensive IT book series.