These days, almost everyone is running an SSD (Solid State) drive in their computer. Most laptops now come with SSD drives exclusively. You only really see older spinning disks as secondary data drives in new computers since SSD drives such as NVMe drives are so much faster and tend to be used to run Windows and other operating systems.
SSD drives do not have any moving parts and when they start to fail, you will not hear the typical spinning disk clicking sound that indicates a pending issue. This is where SSD monitoring software comes into play to help you manage the health of your hard drives. In this article, we will be showing you how to check your SSD power on count, power on hours plus other health stats with CrystalDiskInfo.

CrystalDiskInfo is a free and lightweight drive‑monitoring tool that displays detailed health information for SSDs, NVMe drives, and even traditional hard disks. It reads SMART data to show stats like temperature, power‑on hours, power‑on count, drive health status, error rates, and firmware details.
There is an installable and standalone version of CrystalDiskInfo and many people prefer the standalone version since there is nothing to install on your computer. Once you download and extract the zip file, you can simply run the DiskInfo64.exe file to open the app.
Once CrystalDiskInfo is running, you will see a lot of information about your drive. If you have more than one hard drive in your system, you will be able to toggle between them by clicking on the one you want to view at the top of the app or by using the back and forward arrow buttons.
You will also see the overall health status, which is an indication of how much life the drive has left. Plus, it will show the overall temperature of the drive below that so you can see if it’s running hot for example.
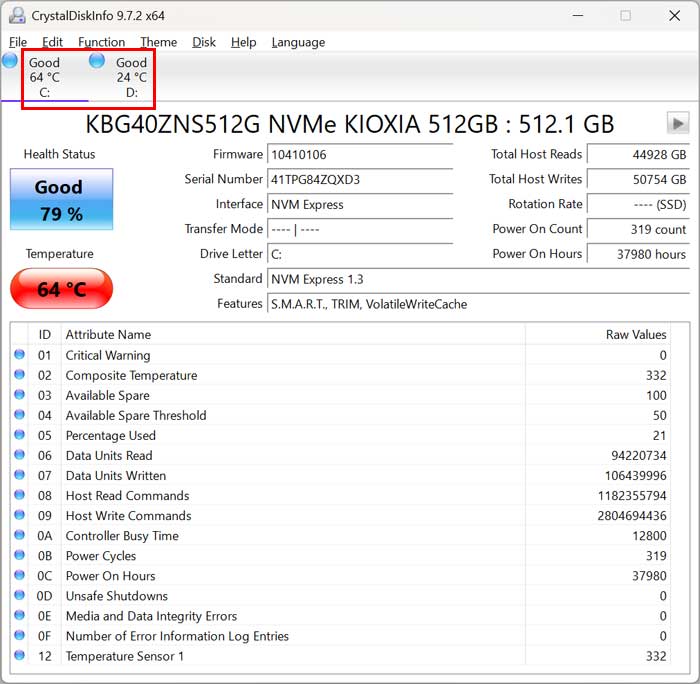
CrystalDiskInfo shows detailed information about your drive such as the firmware version, serial number, interface (connection type) and what features your drive has such as S.M.A.R.T, NCQ, APM, DevSleep or TRIM for example.
On the right side of the app, you will see details about how much data was read from and written to the drive as well as how many times it was powered on and how many hours it has been running. The power on hours is not how many continuous hours it has been running but rather total hours. There are several ways to find out how long your computer has been running.
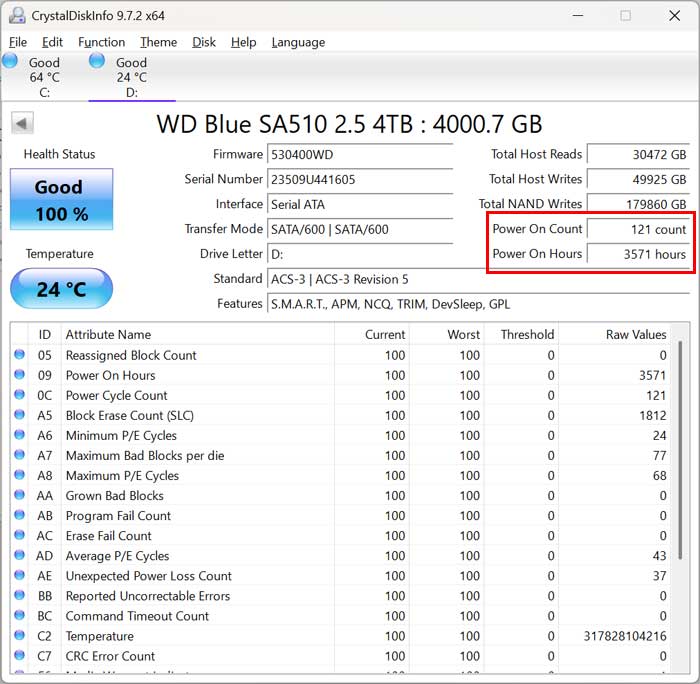
The bottom pane shows several other attributes about your hard drive such as CRC error count, grown bad blocks, program fail count, unexpected power loss count and more. Many of these metrics will not be too helpful but that will depend on your needs. You will also notice that the raw values are in hexadecimal which can be converted to decimal or you can change the display type in the app settings.
CrystalDiskInfo has some additional settings you can configure, and most can be found under the Function menu and Advanced Feature sub menu.
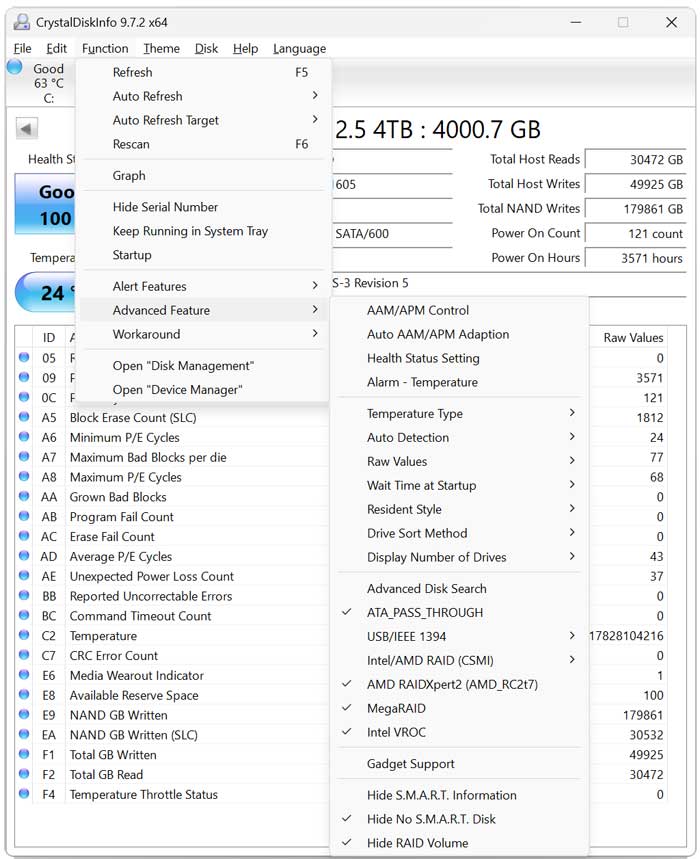
For example, if you want to change the temperature display from Celsius to Fahrenheit you can do that from here. You can also do things such as setting up email or audio alerts for things such as your drive getting too hot.
For additional training resources, check out our online IT training courses.
Check out our extensive IT book series.