Last Updated on March 21, 2026
With everything being connected and done online, it makes sense that your computer would be connected to various websites, online services and even networked devices at the same time. In fact, you might not even know about many of the network connections your computer is making at any given time. In this article, we are going to show you how to view your computer’s network traffic with the free Network Traffic View App.
Downloading and Running the Network Traffic View Software
The Network Traffic View tool by Nirsoft is a simple app that you can run without having to install the software first. Once you download the zip file and extract it, you can simply run the NetworkTrafficView.exe executable file to start the program. If you don’t run it as an administrator, you will be prompted to do so, and it will restart the app using administrative credentials so make sure you have administrator rights on your computer.
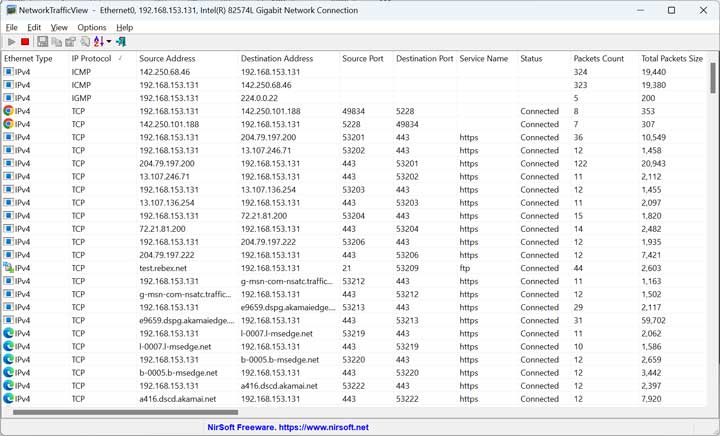
When the software loads, it will immediately start capturing data by default even though you can change this setting. There are several columns of information such as protocol, source and destination address, ports used, packet counts, speed, duration, latency, TTL and more.
Interpreting the Results
It will take a few moments for the Network Traffic View app to read all the network traffic taking place on your computer and it will also update itself as things change. You can sort the results by any column simply by clicking on that column header\name. The Ethernet Type column will show the icons of the software related to that traffic if possible.
For example, if you are more concerned with data such as what services your computer is connecting to then you can sort by the Service Name column. If you find that there are too many columns that don’t have information you find useful, you can go to the View menu and select Choose Columns and simply uncheck any that you do not want to be shown.
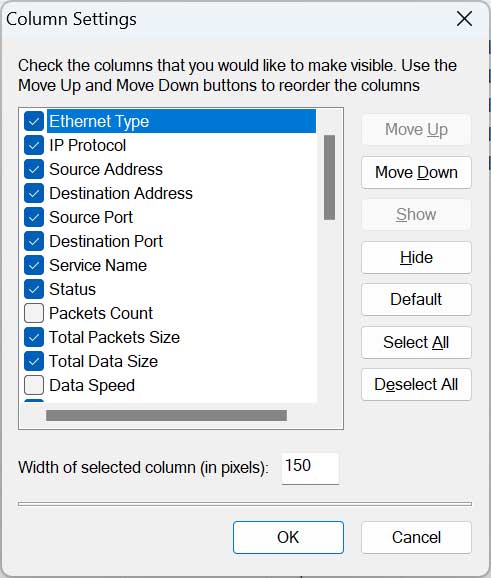
Once you have the interface streamlined, you will find that it’s very easy to locate the data you are looking for.
Exporting your Results
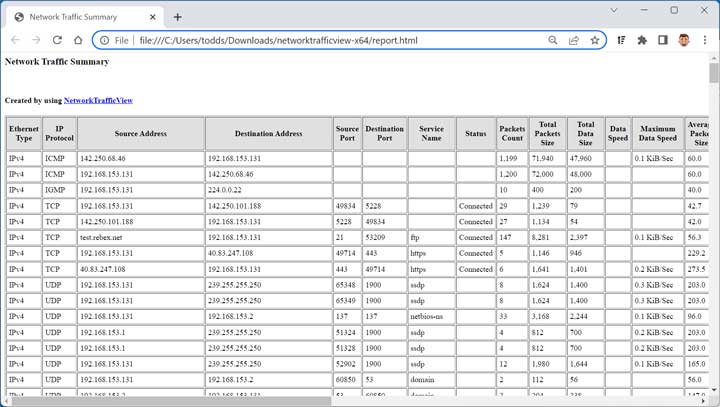
If you need to create a report of some or all of the results, this can be done by exporting all the results or just results that you have selected to an HTML report. Once you choose this option, the report will automatically be generated for you and opened in your web browser. You can then do things like print or email the report as needed.
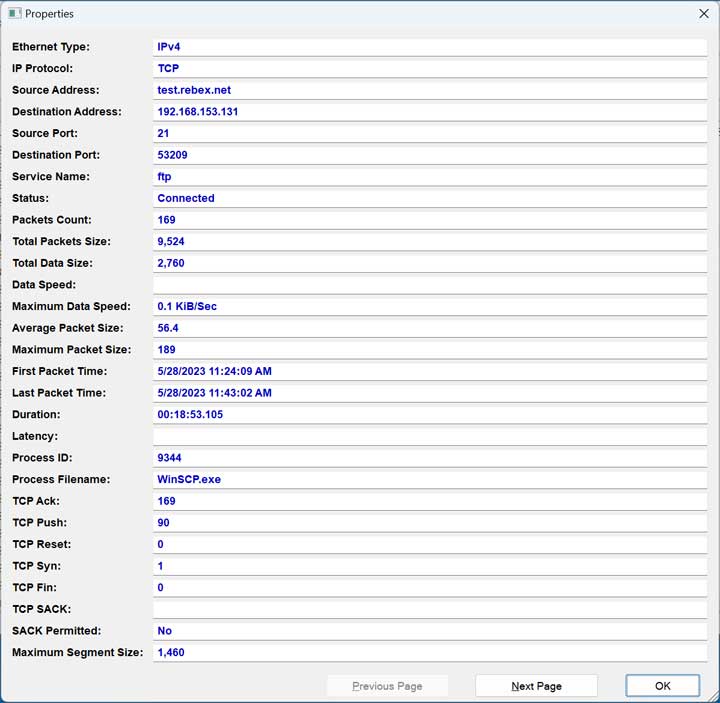
You can also double click a result to be shown its properties.
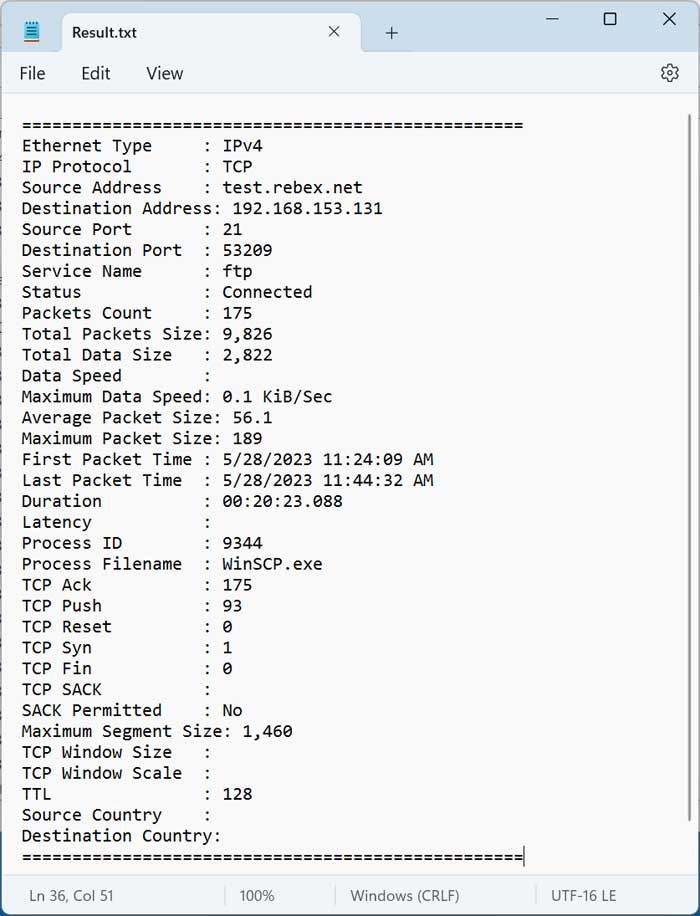
If you right click a result and choose Save Selected Items, you will then be able to save the same results in a text file. There is also a Copy Selected Items option if you want to copy these results to the clipboard.
Network Traffic View Options
There are several options you can configure within the Network Traffic View app to help you collect the network traffic that suits your needs. If you go to the Options menu, you will see that you can configure settings for things such as how addresses and processes are displayed, which types of packets you want to be shown and also what unit of speed the results are displayed in.
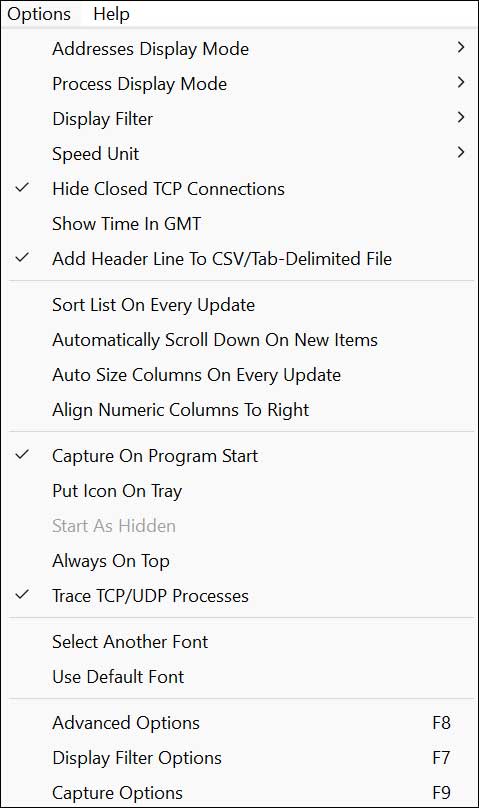
The Advanced Options will allow you to change grouping options as well as let you choose which ports to include or exclude.
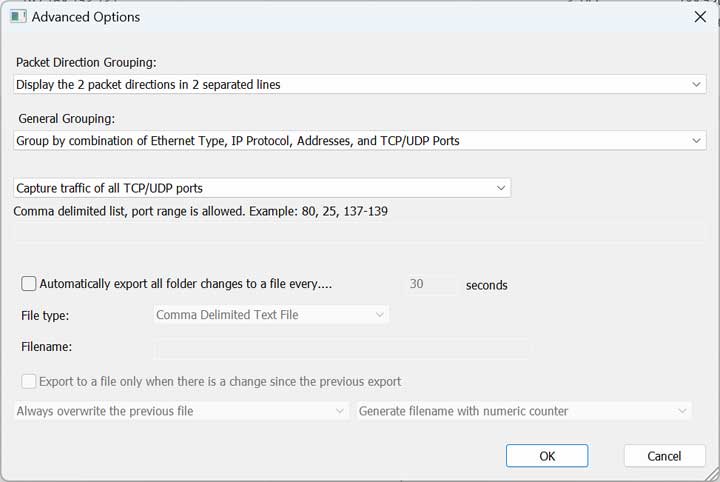
The Display Filter Options will allow you to filter results based on speed, packet count and duration. The Capture Options will let you choose the capture method such as Raw Sockets, WinPcap and Network Monitor Driver.
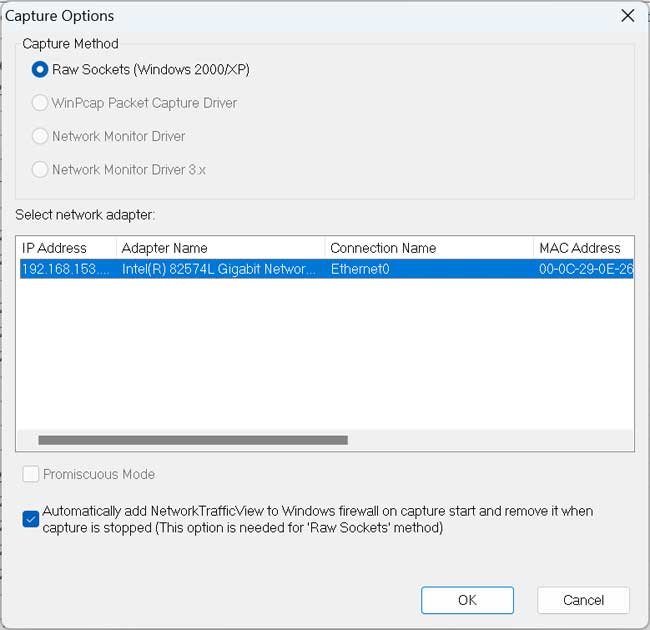
There are many other settings and views you can configure so it’s best to get the software running and then start making adjustments until you find what works the best for you.
For additional training resources, check out our online IT training courses.
Check out our extensive IT book series.


