
Last Updated on August 9, 2026
When network issues strike, knowing how to diagnose the connection quickly saves hours of trial and error. This applies whether a local printer drops offline or an entire office workstation loses internet access completely. Windows includes powerful built-in command-line utilities that allow you to inspect network adapters, verify router communication, and test domain name resolution without installing third-party software.
Following a structured troubleshooting approach helps you isolate network problems step by step from your local network card out to public internet servers. This specific guide covers five fundamental command-line utilities including ipconfig, ping, tracert, nslookup, and netstat. We will cover their core functions, advanced command switches, real-world troubleshooting scenarios, and practical image examples.

ipconfig: Checking Your Local Network Configuration
1. Understand the Baseline ipconfig Command
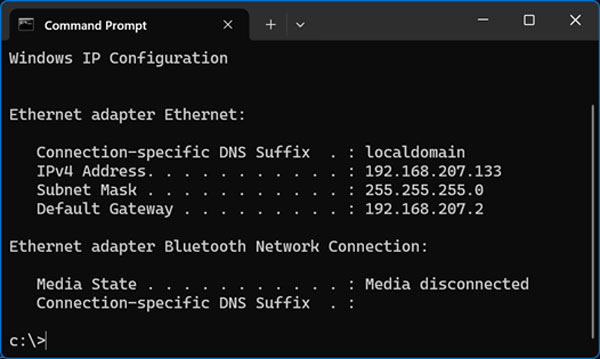
The ipconfig (IP Configuration) command is the starting point whenever a device loses network connectivity. It queries your operating system network stack to report active IP addresses, subnet masks, and default gateway settings. This applies to every single network interface card installed on your system. Running this command immediately tells you if your computer is properly connected to your local network or router.
2. Identify a Missing Default Gateway
When reviewing standard ipconfig output, look out for three common indicators of connection failure. If the Default Gateway line is completely blank, your computer cannot send network traffic beyond your local router. This missing address prevents you from reaching the public internet entirely.
3. Spot an APIPA Address
You might see an address starting with 169.254.x.x assigned to your network adapter. An Automatic Private IP Address means your computer failed to contact a DHCP server on your network. Your system assigned itself a temporary fallback address which will not route traffic online.
4. Check for a Subnet Mismatch
Your IP address or subnet mask might not match the IP range used by other devices on your local network. If this happens, your PC cannot talk directly to local servers or printers. You must reconfigure your adapter to match the correct subnet parameters.
5. View Full Diagnostic Details
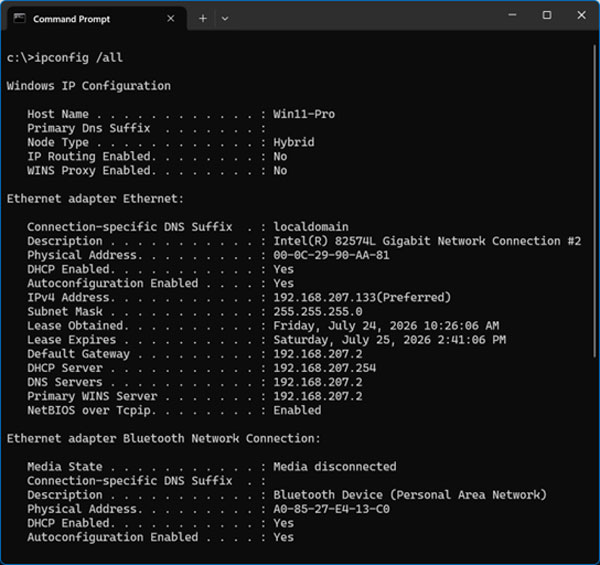
To get deeper diagnostic details you can run ipconfig with several optional switches. Running ipconfig /all displays detailed diagnostic data for all adapters. This includes physical MAC addresses, DHCP server IP addresses, lease start and expiration dates, and assigned DNS servers.
6. Clear the DNS Resolver Cache
Running the ipconfig /flushdns command wipes out stale or corrupted local DNS lookup entries stored on your computer. This resolves loading errors when websites switch hosting providers or update their IP addresses. It forces your system to fetch fresh records from the internet.
7. Release and Renew DHCP Leases
You can forcibly drop your current DHCP address assignment using the ipconfig /release command. Following that up with ipconfig /renew requests a completely fresh network configuration. Your local router or DHCP server will assign you a new working IP address.
ping: Testing Reachability and Latency
1. Send ICMP Echo Requests
The ping command uses ICMP Echo Request messages to test whether a target host is active across a local network or the internet. It measures the Round-Trip Time in milliseconds and records packet loss rates to evaluate link quality. System administrators rely heavily on ping to verify basic IP reachability before attempting higher-level protocol troubleshooting.
2. Troubleshoot Request Timed Out Errors
Analyzing ping response messages helps you narrow down the exact source of a network slowdown or outage. A Request Timed Out message means the target host is turned off or physically disconnected. It can also mean a strict firewall is currently blocking incoming ICMP echo requests.
3. Diagnose Destination Host Unreachable
You might see a Destination Host Unreachable error when running this test. This means your local system or default gateway does not have an active route listed in its routing table. The router simply does not know how to forward traffic to the destination IP address.
4. Identify High Latency or Jitter
Consistently high response times indicate severe local network congestion, bufferbloat, or physical line degradation. Seeing response times at 200ms or higher usually results in a terrible user experience. You need to investigate the physical hardware if these numbers stay elevated.
5. Perform Continuous Ping Monitoring
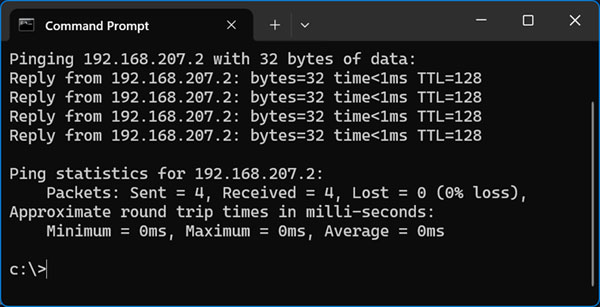
You can customize ping tests using flags to perform continuous monitoring or test network packet size limitations. Running ping -t google.com pings the destination continuously until you manually stop the process using the Ctrl + C keyboard shortcut. This is incredibly useful for monitoring link stability while swapping cables or rebooting network hardware.
6. Set a Custom Echo Request Count
The standard ping test in Windows stops after sending exactly four packets. Running ping -n 10 1.1.1.1 overrides this limit and sends a specific count of ICMP packets. This provides a much better statistical sampling for diagnosing intermittent drops.
7. Adjust the Packet Buffer Size
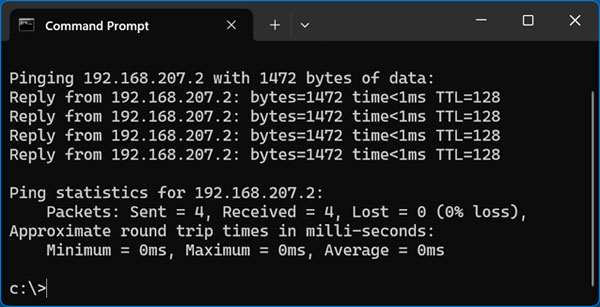
Running ping -l 1472 192.168.1.1 adjusts the exact byte size of the ICMP payload sent with each request. Network technicians use this specific switch to test Maximum Transmission Unit limits. It helps detect packet fragmentation issues across complex WAN links.
tracert: Mapping Network Packet Routes
1. Trace the Packet Path
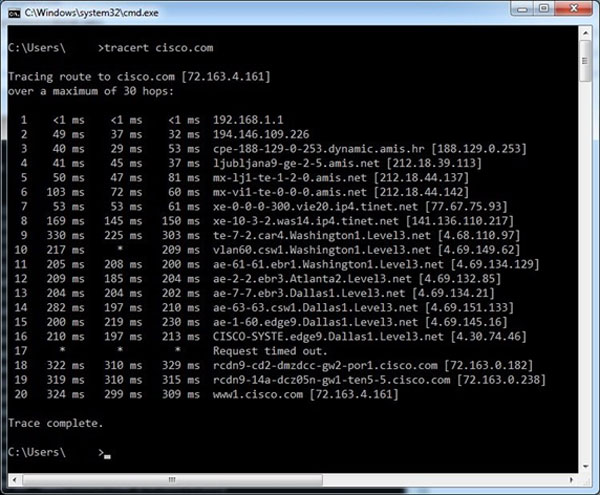
The tracert command traces the exact path a data packet travels from your local computer to a destination IP address or domain name. It displays every single router hop along the path alongside individual response times. tracert works by sending ICMP packets with gradually increasing Time to Live values.
2. Understand Router Hops
Each intermediate router drops the packet when its TTL reaches zero. The router then returns an ICMP Time Exceeded message back to your system. This process builds a complete map of the network route taken by your internet service provider to reach external web servers.
3. Isolate Connection Drops and Loops
Running this command shows the exact router hop where packet responses completely stop or time out. It also reveals whether traffic is stuck in an infinite loop between misconfigured core routers. This data points you directly to the failing hardware.
4. Speed Up Tracing by Disabling DNS Lookups
Running a trace route can take a long time if public routers along the way do not return reverse DNS names. Running tracert -d 8.8.8.8 prevents tracert from performing reverse DNS lookups on every router IP address. This optional switch speeds up the trace execution significantly.
5. Limit the Maximum Hop Count
The default trace route configuration allows for a maximum of 30 hops before terminating. Running tracert -h 15 cisco.com restricts the maximum number of intermediate hops checked. This saves time if you only care about the local segment of the routing path.
6. Adjust the Response Timeouts
Running tracert -w 500 1.1.1.1 changes the time limit your system waits for each router reply in milliseconds. Lowering this value accelerates traces on fast enterprise networks. Increasing it prevents false timeouts on slow satellite or cellular links.
nslookup: Diagnosing DNS Resolution and Server Records
1. Query DNS Servers Directly
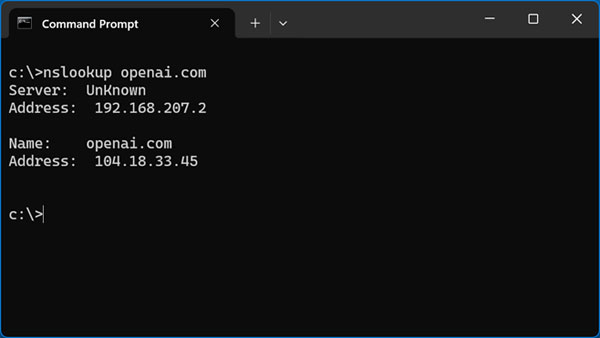
The nslookup command queries Domain Name System servers directly to convert human-readable hostnames into network IP addresses and vice versa. It is built natively into Windows, Linux, and macOS operating systems. IT professionals use nslookup to confirm domain IP mappings, test internal DNS server health, and verify public security records.
2. Query Custom DNS Resolvers
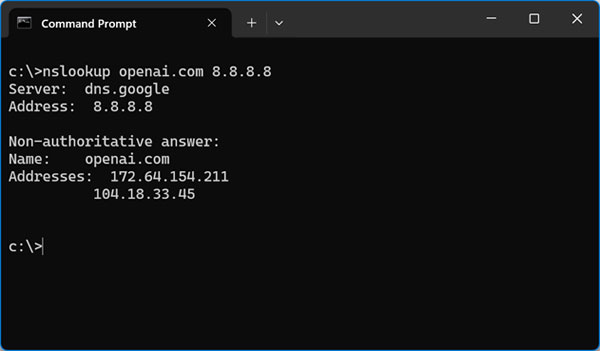
When troubleshooting local domain lookup issues, you can query a public DNS server directly. Running nslookup openai.com 8.8.8.8 forces the tool to bypass your local network settings. This tests if domain propagation issues are caused by your local DNS server or an external host.
3. Check A and AAAA Records
nslookup supports checking specific DNS record types to verify web server configurations and email authentication rules. An A Record maps a domain name directly to an IPv4 host address. An AAAA Record performs the exact same function for modern IPv6 host addresses.
4. Verify Mail Exchanger and Canonical Names
Checking the MX Record points incoming email traffic to active mail domain servers. Querying the CNAME Record redirects an alias domain name to a primary domain. These records must be configured perfectly for corporate email to flow properly.
5. Inspect TXT and Name Server Records
The TXT Record holds plain text used for strict email security policies and search console ownership verification. The NS Record identifies authoritative DNS servers responsible for managing the entire domain zone.
6. Use the Interactive Shell Mode
You can check specific record types by running nslookup in interactive mode. Type nslookup without arguments, type set type=txt, and enter target domain names sequentially. This keeps the prompt open for rapid-fire DNS testing.
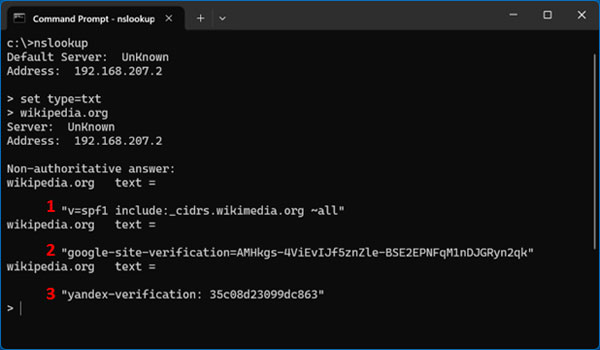
Here is what is shown in the command above.
1. Anti-Spam Security (SPF)
Looking at the first output line in the image, this TXT record tells the world exactly which servers are allowed to send emails from the @wikipedia.org domain. It stops scammers from spoofing emails. This strict SPF policy protects the domain reputation and ensures messages reach user inboxes safely.
2. Google Proof-of-Ownership
The second line reveals a specific verification code pasted directly into the public DNS records. It proves domain ownership to Google Search Console. Webmasters use this exact method to gain access to sensitive search analytics without modifying the actual web server.
3. Yandex Proof-of-Ownership
The third entry functions exactly the same as the Google verification code mentioned above. It proves domain ownership to Yandex. Adding these unique text strings is a standard industry practice for verifying site control across multiple search platforms.
netstat: Auditing Active Network Connections and Open Ports
1. Monitor Real-Time Network Activity
The netstat command acts as a real-time monitor for all network activity on your machine. It provides a comprehensive list of every active TCP and UDP connection. This tool is extremely useful for identifying rogue background software, checking application port bindings, and troubleshooting port access errors.
2. Use Essential netstat Command Switches
To display complete process ownership and IP address information, combine netstat with key command switches. The -a switch lists all active connections and ports currently in a LISTENING state. The -n switch shows IP addresses and port numbers in numerical format to bypass slow reverse DNS lookups.
3. Identify Process IDs and Executables
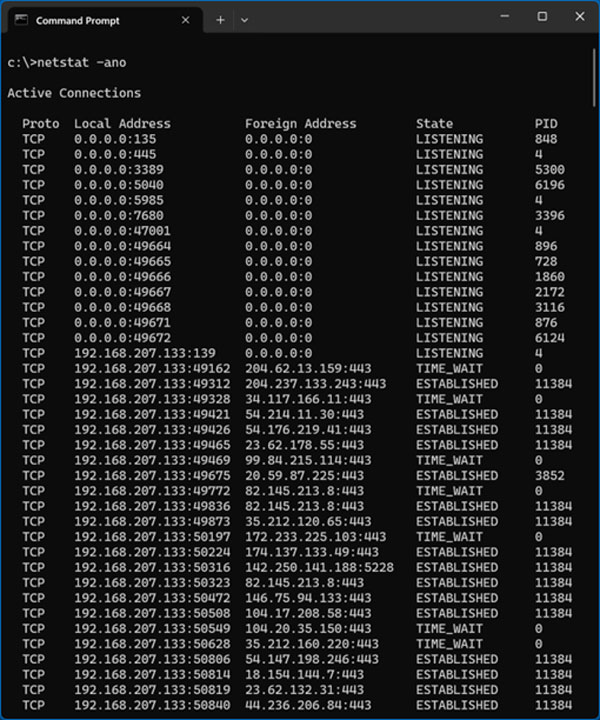
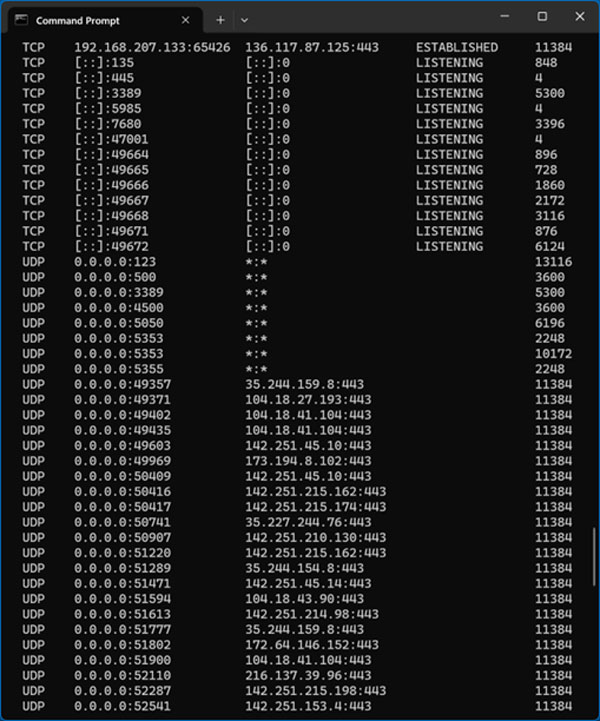
Adding the -o switch displays the Owning Process ID assigned to each network connection. Using the -b switch displays the executable filename responsible for opening each connection. Combining them as netstat -ano gives you a complete numerical overview of your network traffic.
4. Understand the Protocol and Local Address
When reviewing netstat output, each column provides specific operational details about your system network activity. The Proto column indicates the transport protocol used, such as TCP for web browsing or UDP for fast DNS queries. The Local Address column shows your computer IP address followed by the internal port number opened by the application.
5. Review the Foreign Address
The Foreign Address column lists the remote server IP address and port number. Entries listed as 0.0.0.0:0 mean no active outbound connection has been made yet. Seeing port 443 here indicates active communication with an external web server using encrypted HTTPS.
6. Check the Current Socket State
The State column reflects the current lifecycle stage of the network socket. A LISTENING state means an app on your machine is sitting open waiting for incoming network connections. An ESTABLISHED state means an active live data stream is currently connected to a remote destination.
7. Trace the Process ID
The PID column reflects the unique tracking number assigned by Windows to the running application. Filter for lines marked ESTABLISHED to review active connections, then note down the Process ID number. Open Windows Task Manager, go to the Details tab, and match the PID number to identify the exact application running behind the scenes.
For additional training resources, check out our online IT training courses.
Check out our extensive IT book series.