Last Updated on March 26, 2026
Compare the differences between 2 spreadsheets
If you work with a lot of Microsoft Excel spreadsheets, you might run into a situation where you have two versions of the same file. This can be a problem if it’s a large file with a lot of data because it will be difficult to see the differences between the two spreadsheets so you can figure out which is the one you want to use or keep.
When you’re dealing with duplicate Excel workbooks, the challenge isn’t just spotting obvious value changes, but also identifying subtle differences that can affect calculations and results. A single modified formula, formatting change, or hidden value can alter totals, charts, or reports without being immediately noticeable.

Having a reliable way to compare Excel files side by side helps ensure data accuracy, prevents costly mistakes, and saves time that would otherwise be spent manually checking hundreds or even thousands of cells.
Fortunately, Microsoft has considered this problem and has included a solution with its Office suite of software that you can use to compare your Excel spreadsheets, so you don’t have to try and figure out the differences between them yourself.
As you can see below, these two spreadsheets look very similar and at first glance might even look identical. They also contain a fair amount of formulas in many of the cells which makes them even harder to compare to each other.

Opening and Using the Spreadsheet Compare Tool
1. Launch the Comparison Utility
To use the Spreadsheet Compare tool you will first need to open it from your Microsoft Office Tools program group. You can also just search for “Spreadsheet Compare” directly in your Windows start menu to quickly find the application shortcut.
2. Select Your Two Spreadsheets
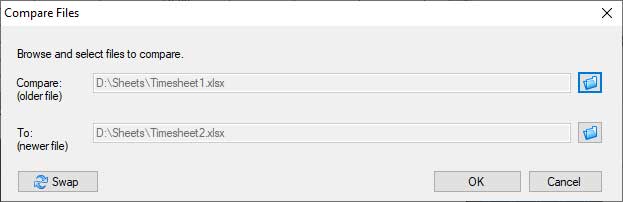
Then you will need to click on the Compare Files button in the top left corner of the ribbon. Click the folder icon next to each text box to browse to the specific location of each one of your spreadsheets.
3. Swap the File Order
You can click on the Swap button to change the order of the files. This dictates which one is considered the new file, and which is considered the older file for the comparison logic. After you click the OK button your files will be opened in the tool and ready to compare.
Analyzing the Spreadsheet Differences
1. Understand the Interface Layout
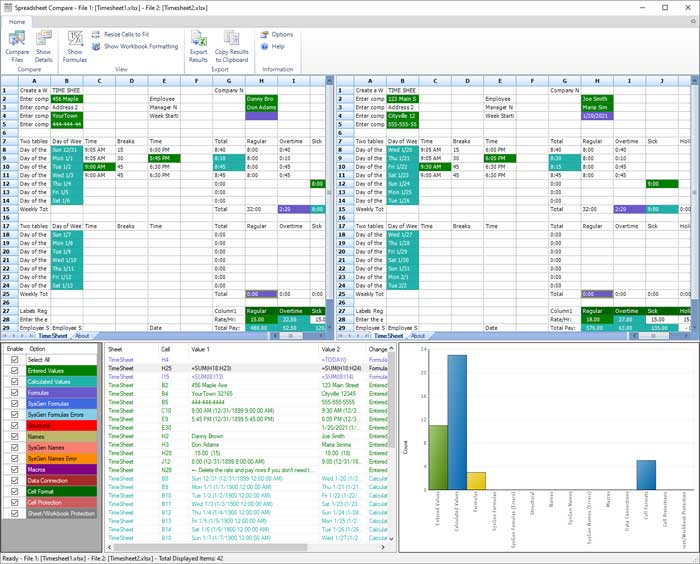
The application interface is broken into several distinct sections. The top two panes will show the actual cells from each of your spreadsheets side by side. The bottom left pane contains the configuration options, and the bottom right pane displays the active results.
2. Review the Color Coded Categories
The cell values in the top panes are colored to match the category options shown in the lower left pane of the tool. You can have the tool compare your files using several different categories. These include Entered values, Calculated values, Formulas, Macros, and Cell format.
3. Filter Your Specific Results
You can check or uncheck any categories you want to use or don’t want to use to change which results are shown. You might want to do one category at a time if you have a large amount of data so its easier to see the exact differences.
4. Highlight the Changed Cells
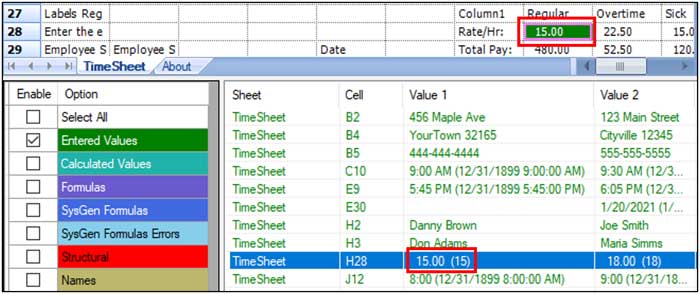
As you click on a specific result in the bottom pane, the cells that the result applies to will be highlighted in the top sheet panes. This allows you to quickly see exactly where the difference is within your file.
5. Review the Visual Bar Chart
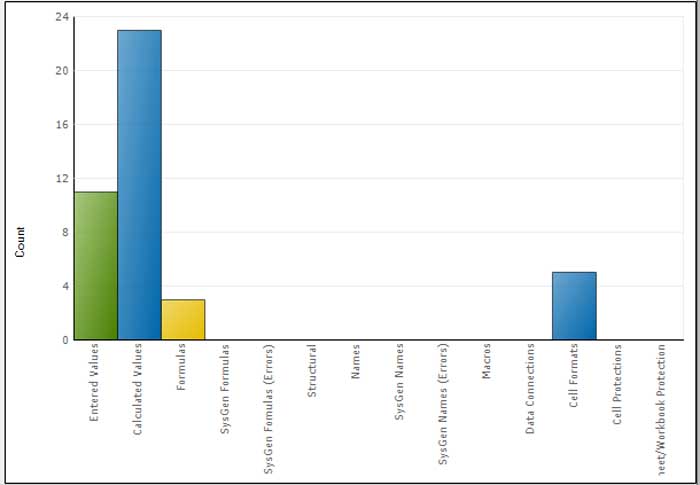
The pane on the bottom right shows a bar chart of the types and numbers of differences between your two spreadsheets. This is more of an informational area to give you an idea of what’s going on between your two files at a high level.
Exporting and Formatting the Results
1. Reveal Hidden Formulas
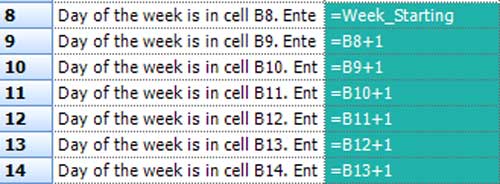
The Show Formulas button on the top ribbon will show the actual formulas used in your spreadsheets within the cells. This gives you a better idea of how many and what types of formulas you are using within your workbooks instead of just showing the calculated values.
2. Adjust the Visual Formatting
The Show Workbook Formatting button will change the view of the sheets to match more closer to what your actual Excel file looks like. This applies the original colors and borders.
3. Export the Results to a New Spreadsheet
If you would like to save the results of your comparison analysis then you can click the button that says Export Results. This will have the changes saved directly to a brand new Excel spreadsheet. You can use this to review the changes later or send to someone who might need them.
4. Avoid the Clipboard Option
This export method works much better than the Copy Results to Clipboard option. If you use the clipboard and paste the raw results into something like Notepad or Word, it will be very hard to read.
For additional training resources, check out our online IT training courses.
Check out our extensive IT book series.